In recent years, employee engagement has dropped for the first time in a decade. In 2020, 36% of workers were engaged at work; that number fell to 34% in 2021 and 32% in 2022, according to a Gallup Poll. This means workers, especially women and young people, feel less enthusiastic about their jobs and less purposeful about their work lives.
Considering the mass layoffs, hiring freezes and remote-work battles of the past two years, it is no surprise that employees are feeling the pinch at work. Not to mention, that as of October, there have been 335 strikes and labor protests this year – most notably the United Auto Workers strike – up from 209 during the same period in 2021.
With so much dust yet to settle as the economy rebounds from the pandemic, business leaders have an opportunity to gain an advantage over their competitors by adapting to modern worker needs to hire the best people. At the same time, workers still have an opportunity to seek higher wages, more purpose, and a better work life balance.
To determine the best and worst states for workers, Peak Sales Recruiting analyzed the most recent data from the U.S. Bureau of Labor Statistics, the Bureau of Economic Analysis, the Census Bureau, the Tax Foundation and the Massachusetts Institute of Technology.
We factored in eight metrics, including job and GDP growth, union representation, weekly hours worked, commute times, remote work, and earnings ratio, which measures the living wage needed to support a family against the median wage.
Key Findings:
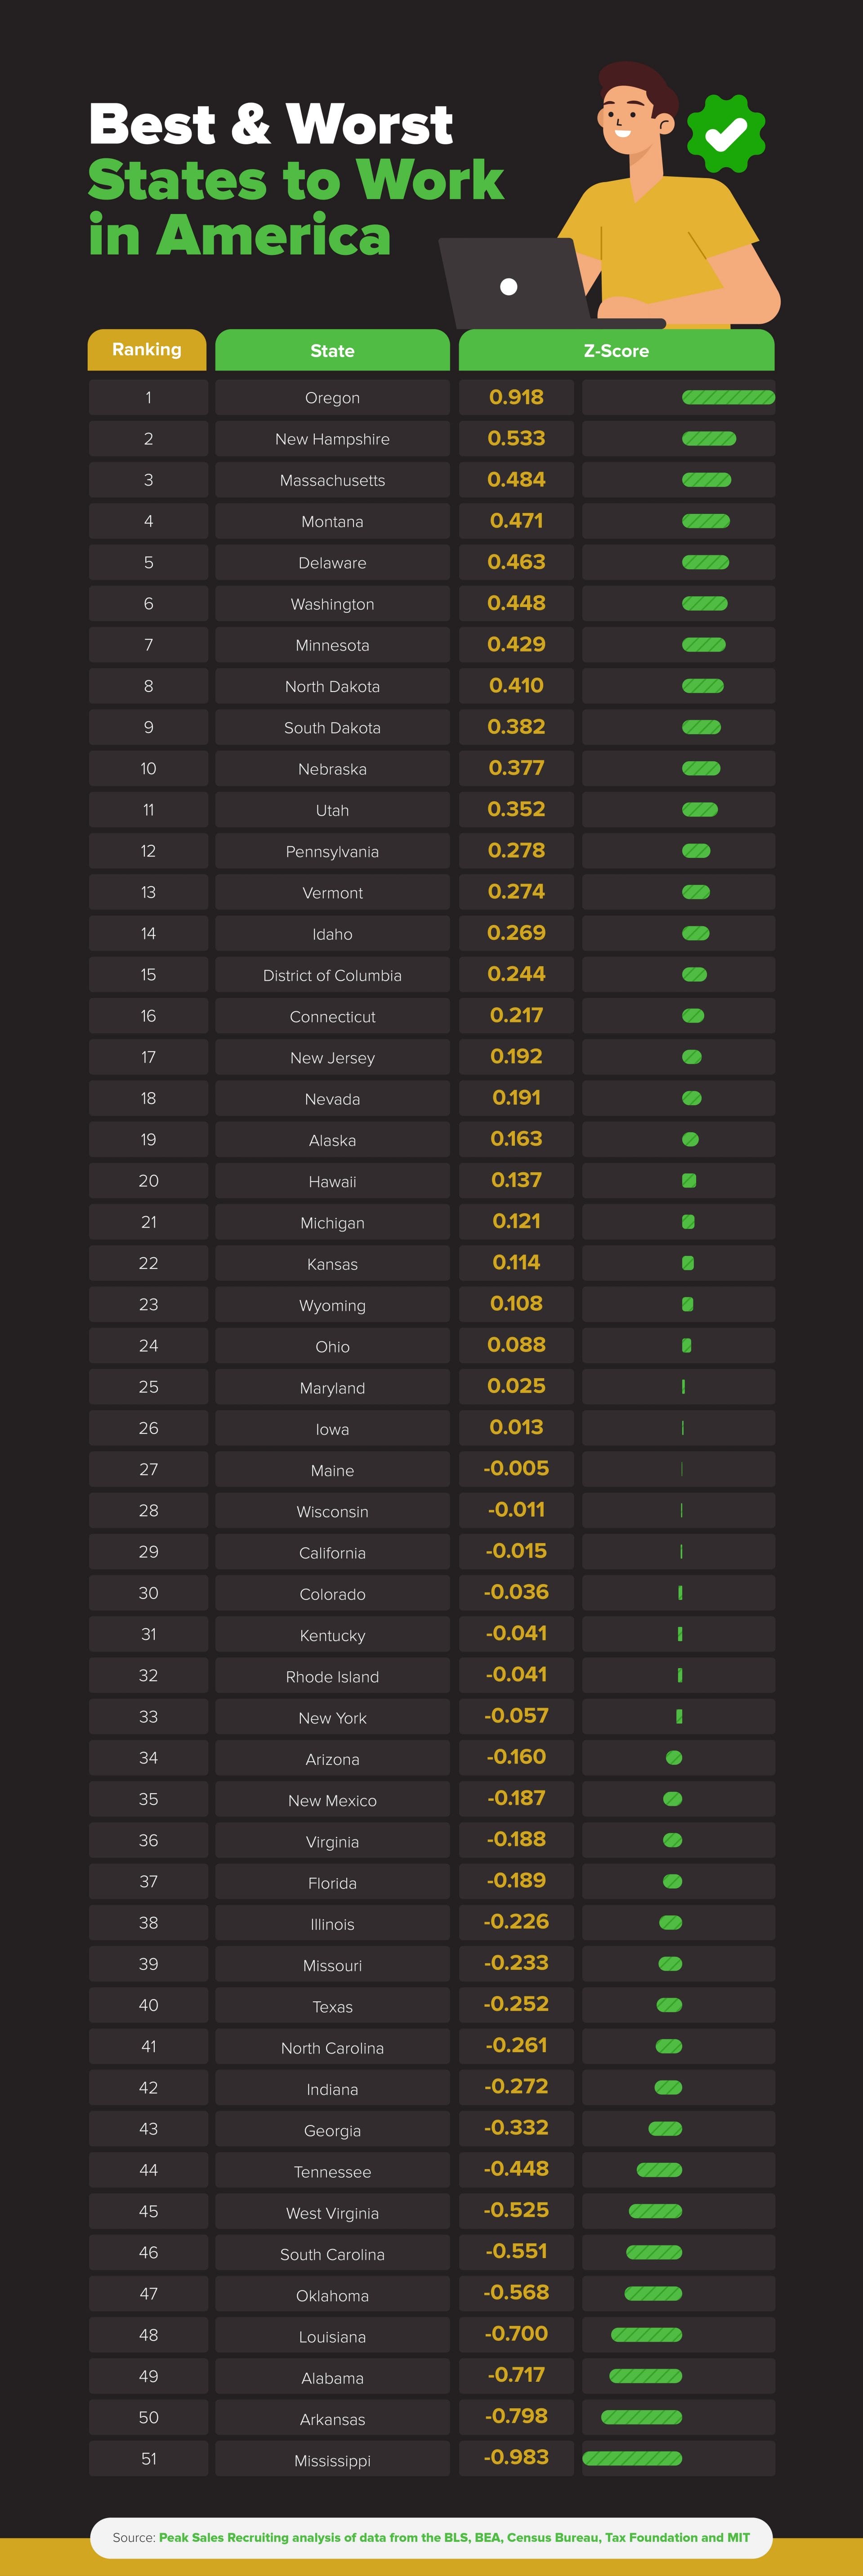
- Oregon Is the Best State for Workers: Driven by its strong union representation (16.9%), short work week (an average of 37.8 hours) and solid growth rates for jobs (2.2%) and GDP (3.8%).
- Top States Are Spread Across the U.S.: No geographical region dominates the top 10 states for workers. Three are in the Northwest (Oregon, Washington and Montana), while three are on the East Coast (New Hampshire, Massachusetts and Delaware) and four are Midwestern (North Dakota, South Dakota, Nebraska and Minnesota).
- Poorly Ranked States Still Shine in Some Categories: No. 40 Texas, for example, has a job growth rate of 3.2%, stronger than any state except No. 18 Nevada. And in No. 33 New York, 22.1% of workers are represented by a union, the second-highest rate after No. 20 Hawaii.
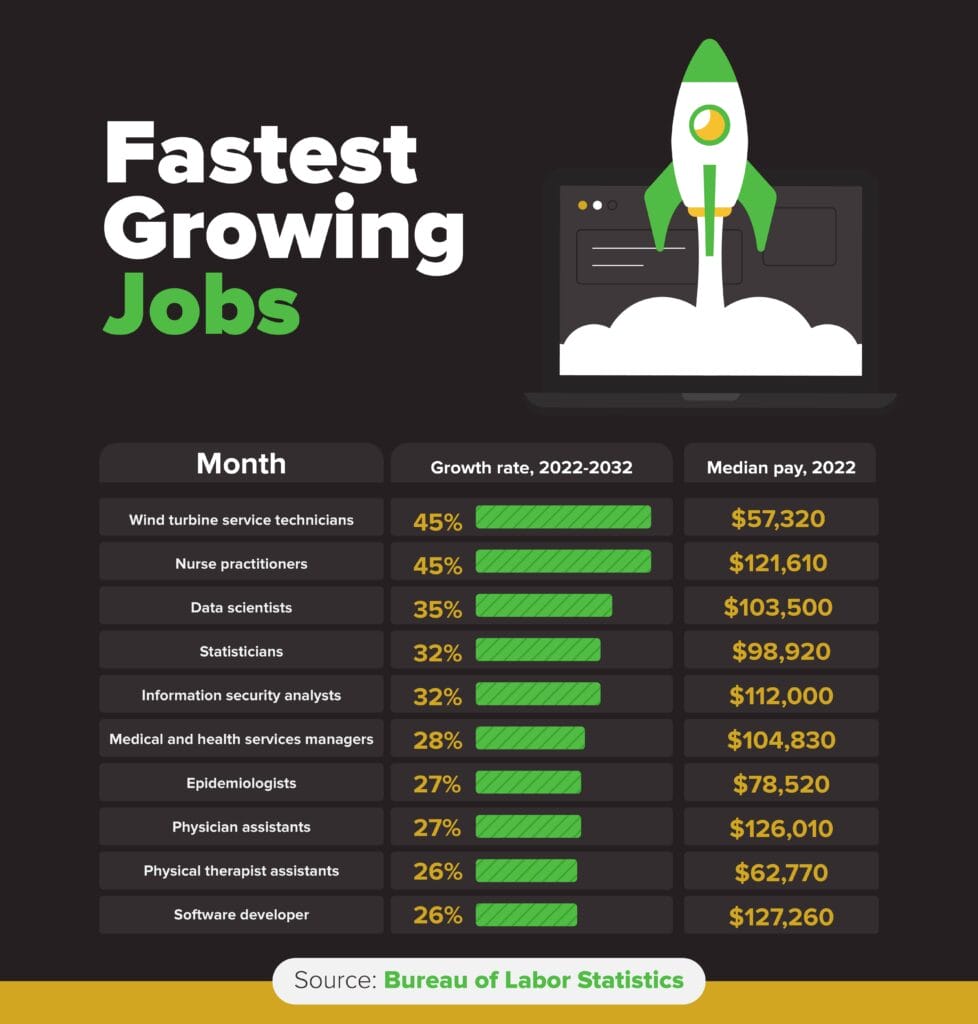
- Fastest Growing Jobs by 2032: Wind turbine technicians and nurse practitioners are tied for No. 1 with both projecting a 45% increase. Five of the top 10 are in healthcare.
Best states
Oregon landed as the best state for workers because it has one of the country’s shortest work weeks (37.8 hours on average), plus a high rate of union representation (16.9%). The Beaver State also has steady job and GDP growth (2.2% and 3.8%, respectively).
Meanwhile, runner-up New Hampshire has no sales tax and an earnings ratio of 1.85, the second-highest rate in the U.S. after the District of Columbia. That means the median income (converted to an hourly wage) for a family of four is $71 – 1.85 times greater than $38.34, which is the hourly living wage needed to support a family of four with one earner.
No. 3 Massachusetts also scored particularly well with an earnings ratio of 1.71, while No. 4 Montana has an average commute time of only 19 minutes and and No. 5 Delaware has no state or local sales tax and steady job growth (2.5%). No. 6 Washington was buoyed by its high rate of remote workers (20.5%), behind only the District of Columbia and Colorado, as well as strong union representation (19.1%), trailing Hawaii and New York.
Rounding out the top 10 are North Dakota, Nebraska and South Dakota, which have some of the shortest commutes and the highest GDP growth rates in the country. In fact, No. 8 North Dakota’s 12.4% GDP growth is more than double the rate of No. 4 Montana, which saw 6% growth. Yet Montana beat out the Dakotas and Nebraska overall due to its stronger union representation, higher share of remote workers and lower taxes.
Worst states
While the best states for workers aren’t geographically concentrated, the worst states are located mainly in the South. Mississippi ranked last, followed by No. 50 Arkansas, No. 49 Alabama and No. 48 Louisiana. Mississippi has the U.S.’s second-lowest job growth rate, at 0.5% (after Rhode Island, which lost jobs at a rate of 0.7%), and people there work an average of 39.7 hours per week, on par with Arkansas and Louisiana for some of the longest weeks in the country.
Louisiana, Arkansas and No. 44 Tennessee also have the highest state and local taxes, while workers in No. 43 Georgia have longer commutes, at 28.2 minutes on average. The worst-ranked states also tend to have poor GDP growth – for example, 0.1% in Alabama and 0.2% in No. 45 West Virginia – as well as lower rates of union representation. In No. 46 South Carolina and No. 41 North Carolina, a respective 2% and 3.9% of workers are covered by unions, the lowest rates in the U.S.
Notably, some of the worst-ranked states have bright points, as well. In No. 48 Louisiana, jobs have grown at a rate of 2.4%, for example, while workers in No. 50 Arkansas and No. 47 Oklahoma have commutes of under 23 minutes, better than in most other states.
By the Metrics
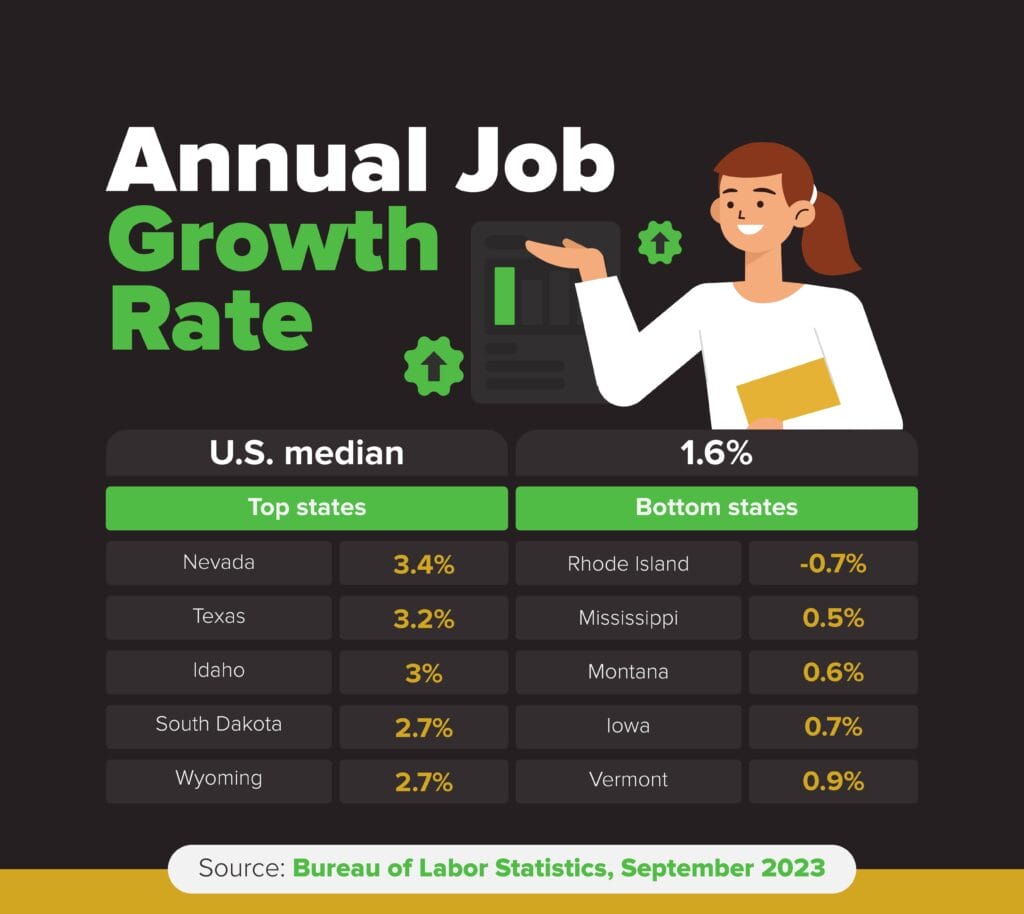
Job Growth
A higher job growth rate suggests that a state has better employment prospects for both unemployed people and workers looking to make a change. At the state level, Nevada ranks No. 1 with 3.4% job growth, followed by Texas and Idaho. Rhode Island ranks last, with a 0.7% decline over the past year.
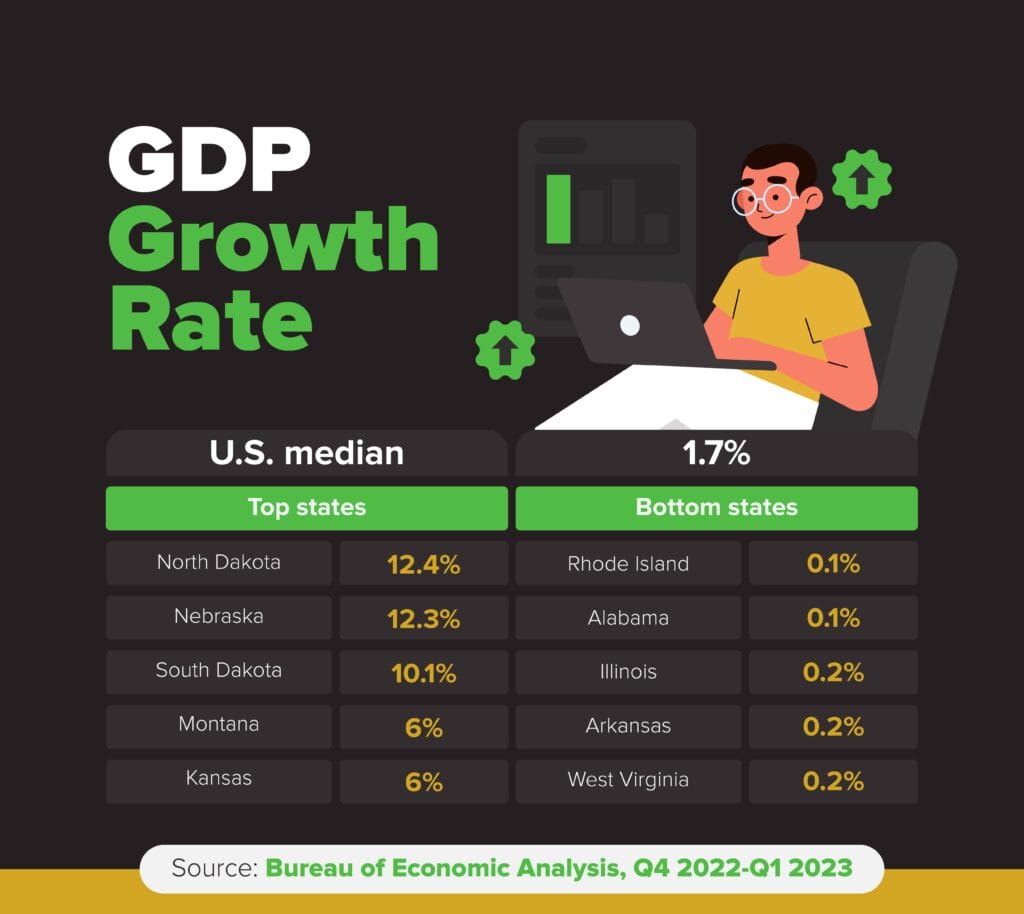
GDP Growth
GDP growth offers insight into the broader economic conditions in a state, which have implications for the labor market and work conditions. North Dakota ranks No. 1 with 12.4% GDP growth, followed by Nevada and South Dakota. Rhode Island ranks last, with 0.1% GDP growth between the last quarter of 2022 and first quarter of 2023.
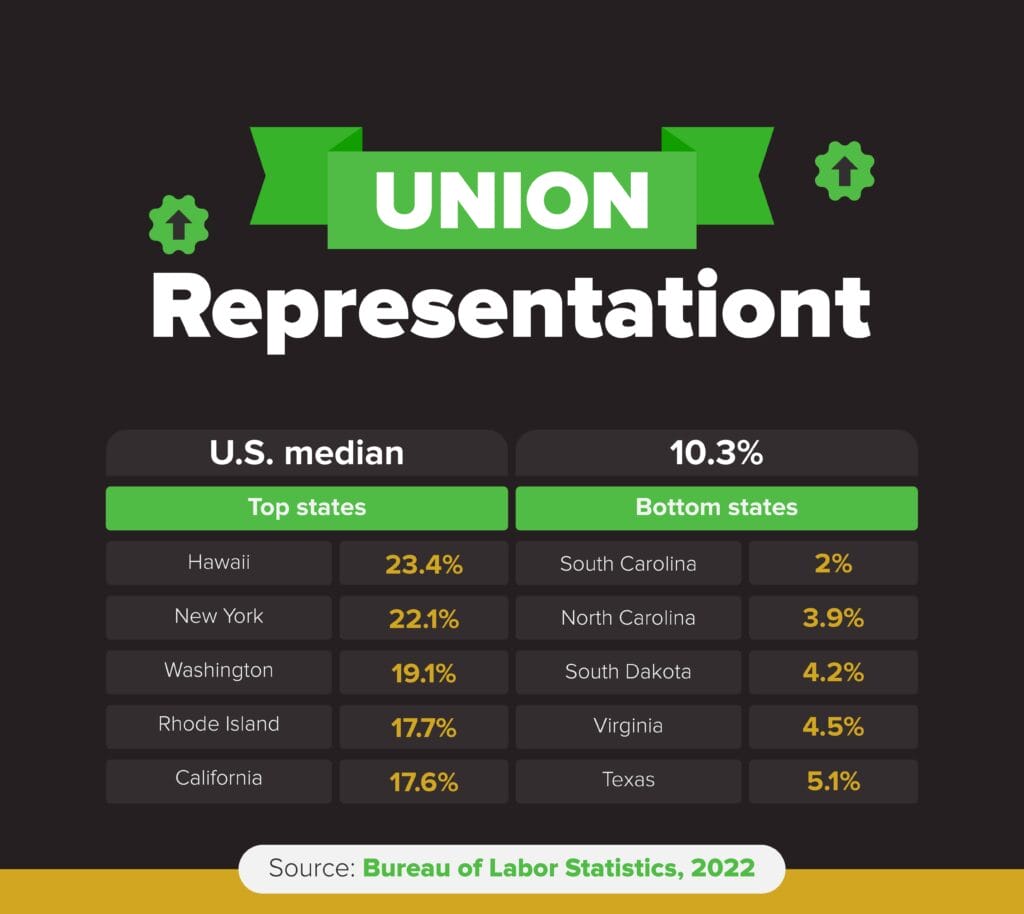
Union Representation
While the impact of unions depends on their strength and state labor laws, good union representation can make a big difference for workers in the form of higher wages, better conditions and more job security. Hawaii ranks No. 1 with 23.4% of workers represented by a union, followed by New York and Washington. South Carolina ranks last, with just 2% of workers represented by a union in 2022.
Work Weeks
Having a shorter work week can improve work-life balance and well-being for workers, while a longer week can lead to more stress and less free time. Utah ranks No. 1 with an average work week of 37.1 hours, followed by Vermont and Rhode Island. Alaska ranks last, with workers putting in an average of 42.2 hours per week.
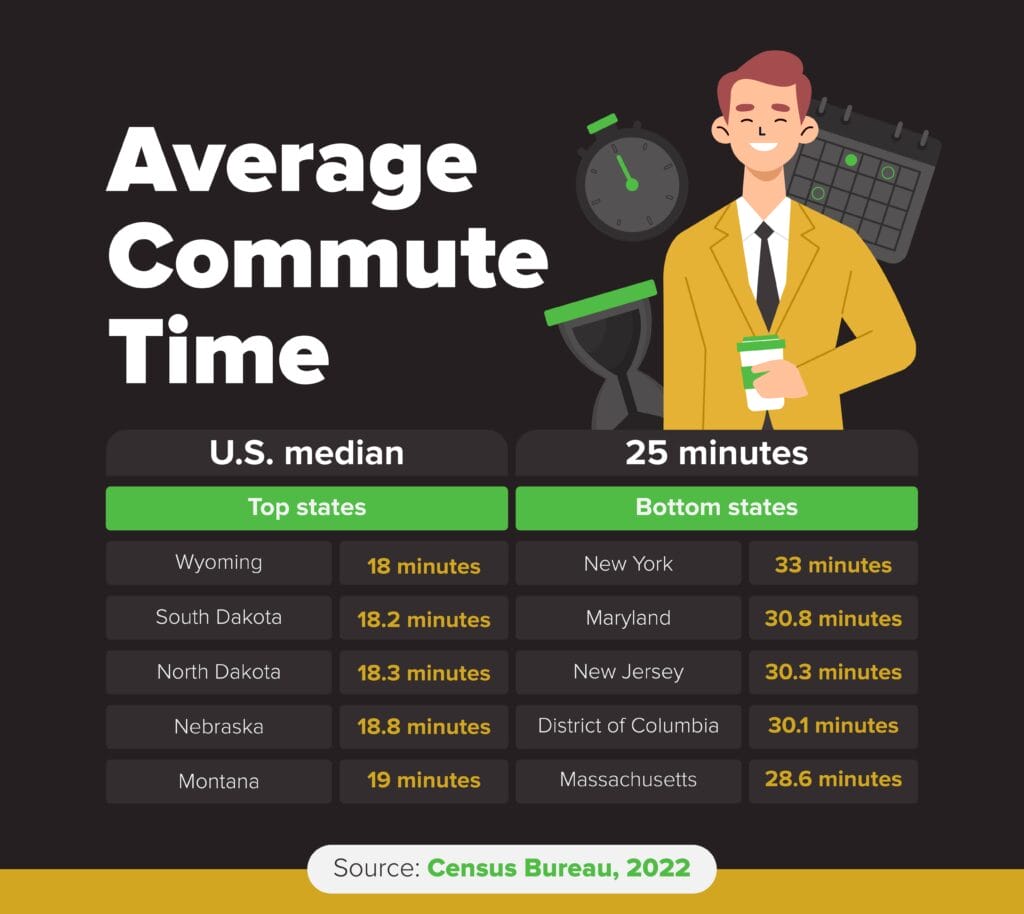
Commute Time
Similarly, shorter commutes mean people spend less time traveling to and from work and can reclaim more of their days. Wyoming ranks No. 1 with an average commute of just 18 minutes, followed by South Dakota and North Dakota. New York ranks last, with an average commute of 33 minutes in 2022.
Remote Work
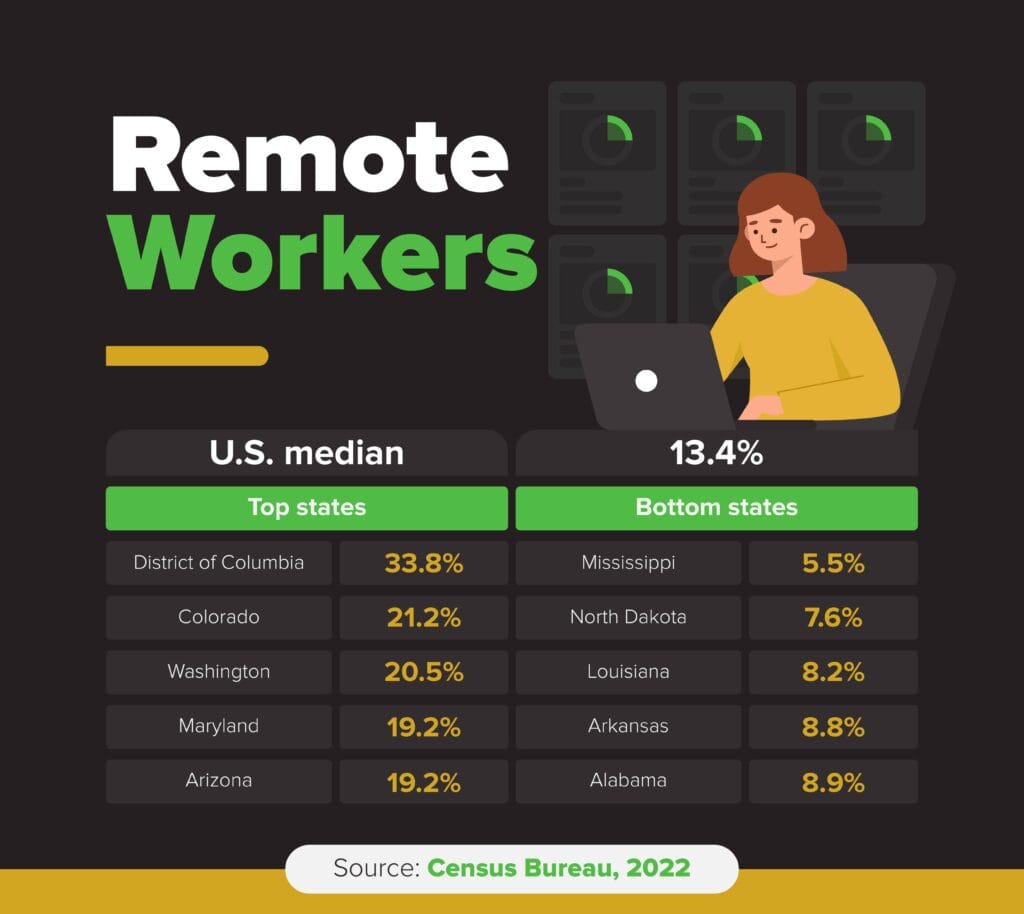
A greater share of remote workers in a state means that more employees have flexibility in their work arrangements, which can enhance job satisfaction. A lower share may mean that fewer jobs can be done remotely, or that they have a traditional office-based work structure. The District of Columbia ranks No. 1 with 33.8% of employees working from home, followed by Colorado and Washington. Mississippi ranks last, with 5.5% of workers being remote in 2022.
State and Local Taxes
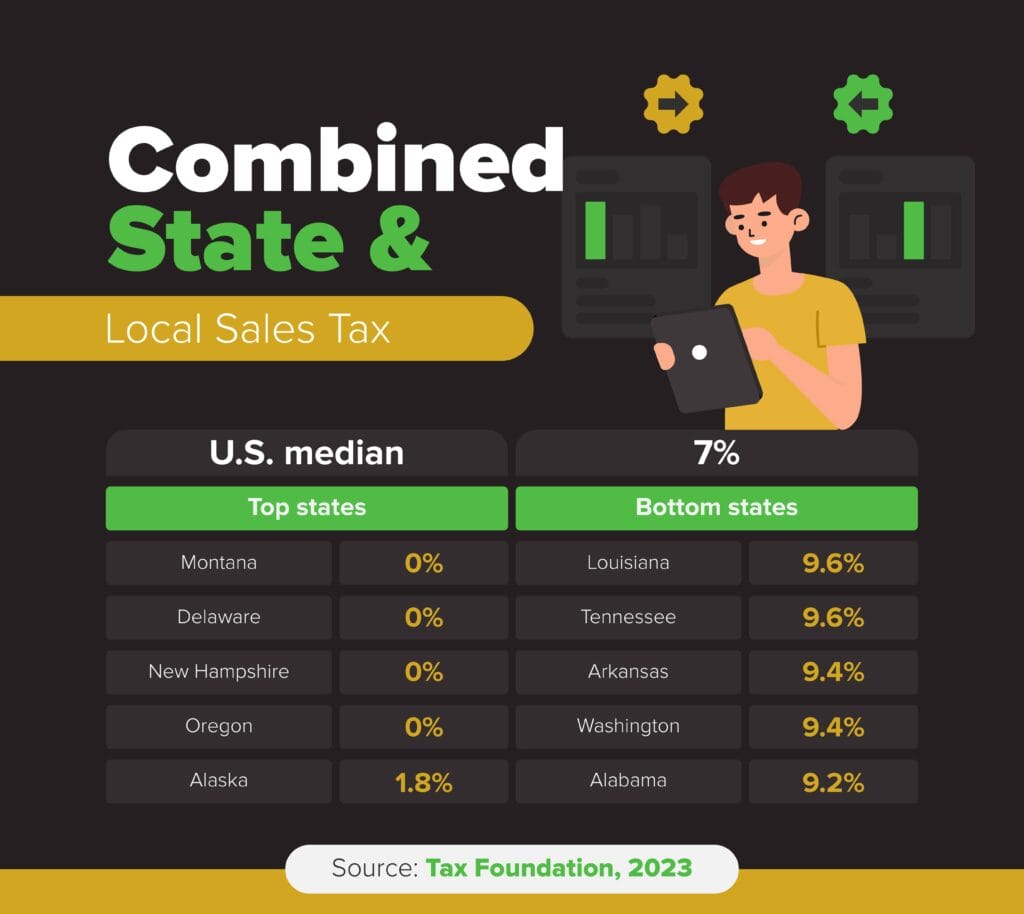
Workers in states with lower tax rates may have more disposable income and the ability to improve their standard of living, though the impact depends on the overall tax structure and their financial position. There’s a four-way tie for first place, given Montana, Delaware, New Hampshire and Oregon all don’t have state or local sales taxes. Louisiana and Tennessee rank last, with state and average local taxes adding up to 9.6% in 2023.
Earnings Ratio
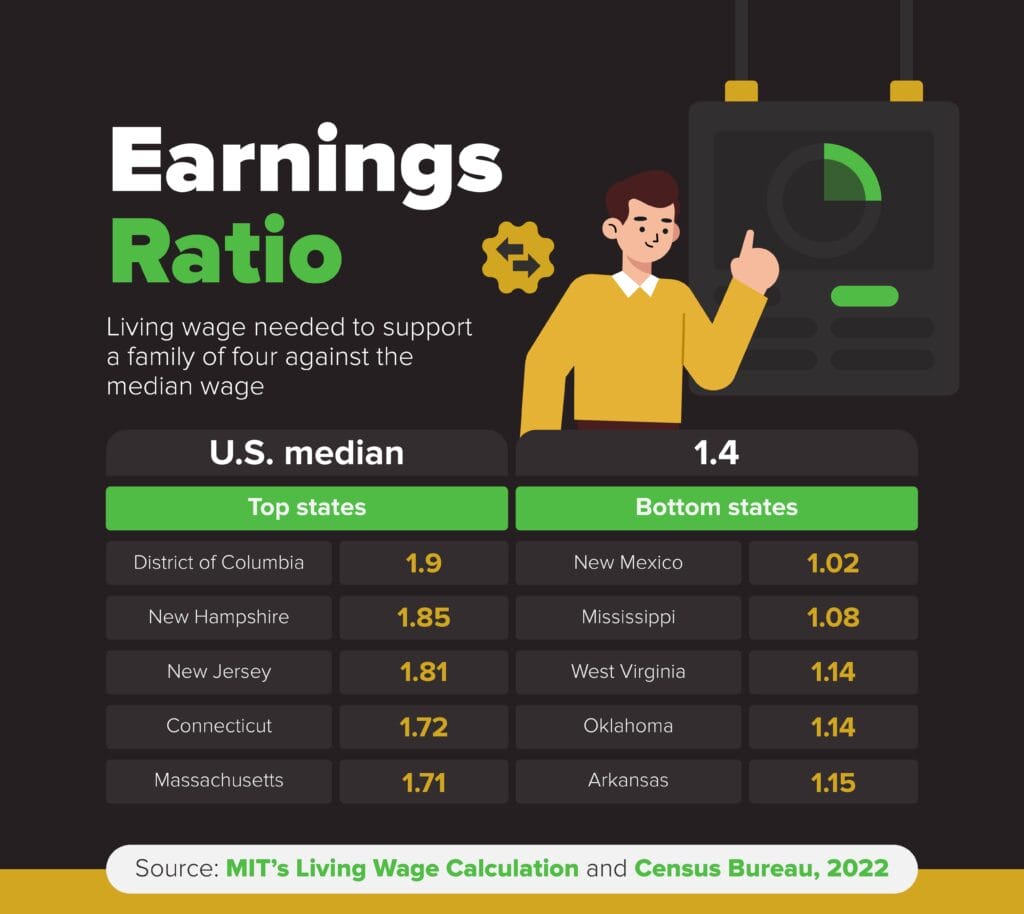
The earnings ratio tracks the median wage against the living wage for a family of four, offering insight into the affordability of a state. Workers in states with higher earnings ratios may have more disposable income. The District of Columbia is No. 1 with an earnings ratio of 1.9, meaning the median wage for a family of four ($83.62) is nearly double the living wage for a family of four with one earner ($43.94). New Hampshire and New Jersey were the runners-up. New Mexico ranks last, with an earnings ratio of 1.02 (median hourly wage of $38.60, and living wage of $37.82).
10 Fastest Growing Jobs in America
Another factor for workers to consider is which types of jobs are likely to increase in the years to come. This gives them an opportunity to position themselves for the jobs of the future. Due to a combination of various macroeconomic factors such as technology and an aging population means that the jobs of tomorrow may look different than the most common jobs over the past several decades.
According to BLS, by 2032, wind turbine technicians and nurse practitioners are tied for No. 1, both projected to see jobs increase by 45%. Five of the 10 fastest growing jobs will be in healthcare, while jobs related to data and software are also well represented.
Recruiting Tips
It can be difficult for companies to identify the right candidate for a job, and for job-seekers to decide if a workplace is a fit. These tips can help create a more successful and rewarding recruitment process for employers and workers alike.
3 tips for workers to get hired
- Be prepared. Tailor your resume and cover letter for each job you apply to, highlighting your most relevant skills and experience. Make sure to research the company and role before an interview, and come prepared with examples of how you’ve succeeded in past roles.
- Network. Attend events to meet other people in your industry, build a strong LinkedIn profile and consider creating a portfolio or personal website, depending on your field. This can help give potential employers a sense of your skills and previous work. Visit the Peak Sales Recruiting website to join our network.
- Keep learning. Invest in your professional development by getting new certifications and joining trainings that help keep you up-to-date in your industry. In interviews, emphasize skills like communication and adaptability to show employers that you will fit well in their company culture.
3 tips for employers to hire the best workers:
- Be efficient in the hiring process: Communicate clearly with candidates during each stage of recruitment, set expectations about the process and aim for a reasonable timeline. Peak’s recruitment process is focused on fulfilling your hiring needs in a timely manner. Visit our website to start your recruitment process.
- Invest in employee development: Do research to ensure your salaries are competitive and your benefits package is in line with industry standards. Offer a clear pathway for career progression, such as training, continuous learning and skills development.
- Highlight company culture and values: Many job-seekers want to work for companies that align with their personal values and offer a good work-life balance. Consider offering remote work or other flexible work options, reward high-performing employees and emphasize your organization’s culture, values and mission.
Conclusion
Overall, the best and worst states for workers depend on an employer and employees’ individual priorities, but this report can help them understand the web of factors that shape working conditions across the nation. States that prioritize workers’ rights, provide remote work opportunities and maintain their cost of living tend to be more worker-friendly, allowing employees to lead more balanced lives and contribute to economic growth and stability.
On the other hand, the worst states for workers typically suffer due to high taxes, long work weeks, limited union representation and sluggish job and GDP growth, which combined, can make it challenging for families to make ends meet. This report underscores the importance of policies to support workers, as well as insights for employers looking to set up shop or expand their businesses in states that make it easier for workers to thrive.
Methodology
We analyzed eight metrics to determine the best and worst states for workers, pulling data from the U.S. Bureau of Labor Statistics, the Bureau of Economic Analysis, the Census Bureau, the Tax Foundation and the Massachusetts Institute of Technology. We used a Z-score distribution to scale each metric relative to the mean across all 50 states and Washington, D.C., and capped outliers at 3. We multiplied Z-scores by -1 if a higher score was negatively associated with being above the national average, including tax rates, commute times and weekly hours worked. A state’s overall ranking was calculated using its average Z-score across the eight metrics. Here’s a closer look at the metrics we used:
- Annual job growth rate (Bureau of Labor Statistics, September 2023)
- GDP growth rate (Bureau of Economic Analysis, Q4 2022-Q1 2023)
- Share of workers who are represented by unions (Bureau of Labor Statistics, 2022)
- Average number of hours worked per week (Census Bureau, 2022)
- Average commute time in minutes among non-remote workers (Census Bureau, 2022)
- Share of workers who work remotely (Census Bureau, 2022)
- Combined state and average local sales tax rate (Tax Foundation, 2023)
- Earnings ratio, calculated as the median wage for a family of four divided by the living wage needed to support a family of four with one earner (MIT’s Living Wage Calculation and Census Bureau, 2022)
Latest posts by Eliot Burdett (see all)
- 31 Must-Know Sales Follow-Up Statistics for 2024 Success - December 21, 2023
- 7 Success Characteristics That Define Top Performers - December 19, 2023
- 5 Reasons Your Top Employees Quit (Stop Doing This to Stop Them Leaving) - December 14, 2023